Solutions
Another function
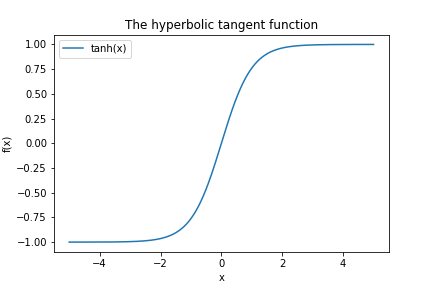
The following code:
x = np.linspace(-5,5,1000)
y_tanh = np.tanh(x)

plt.plot(x, y_tanh, label='tanh(x)')

# Set title and legend, then show plot
plt.title('The hyperbolic tangent function')
plt.legend()
plt.xlabel('x')
plt.ylabel('f(x)')
plt.show()
produces the figure: